Efficiently Run Zen 3 on Low Profile Coolers with Undervolting
Published on:
In this post we will cover how I run the Ryzen 5900x as efficiently as possible under a NH-L9a with the following results:
- A 54% decrease in top power consumption (from 142 watts to 65)
- A 28% decrease in all core performance
- An increase of 40% in performance per watt
- Zero decrease in single threaded performance
- 30 ℃ drop in temperatures and fan speeds reduced by 40%
- See the results section for pretty graphs
If you’re more of a visual learner, I highly recommend Optimum Tech’s videos on undervolting on PBO2 and running the 5950x on a 47mm cooler where he applied PBO2 undervolting with a custom power target, which is what we’ll be doing here, but from a slightly different angle and a bit more background.
🔗 Introduction
I’m fortunate to be living near a microcenter and after having my ear to the ground, I was able to secure a Ryzen 5900x after a month of searching. Upgrading from a Ryzen 2700, the performance increase was massive. As a software developer I compile code all day and single core performance is as important as multi core as there are stages in compilation that are single threaded. After upgrading, compilation time for a project of mine was cut in half (8 minutes to 4), and certain single threaded microbenchmarks saw a 3x throughput improvement.
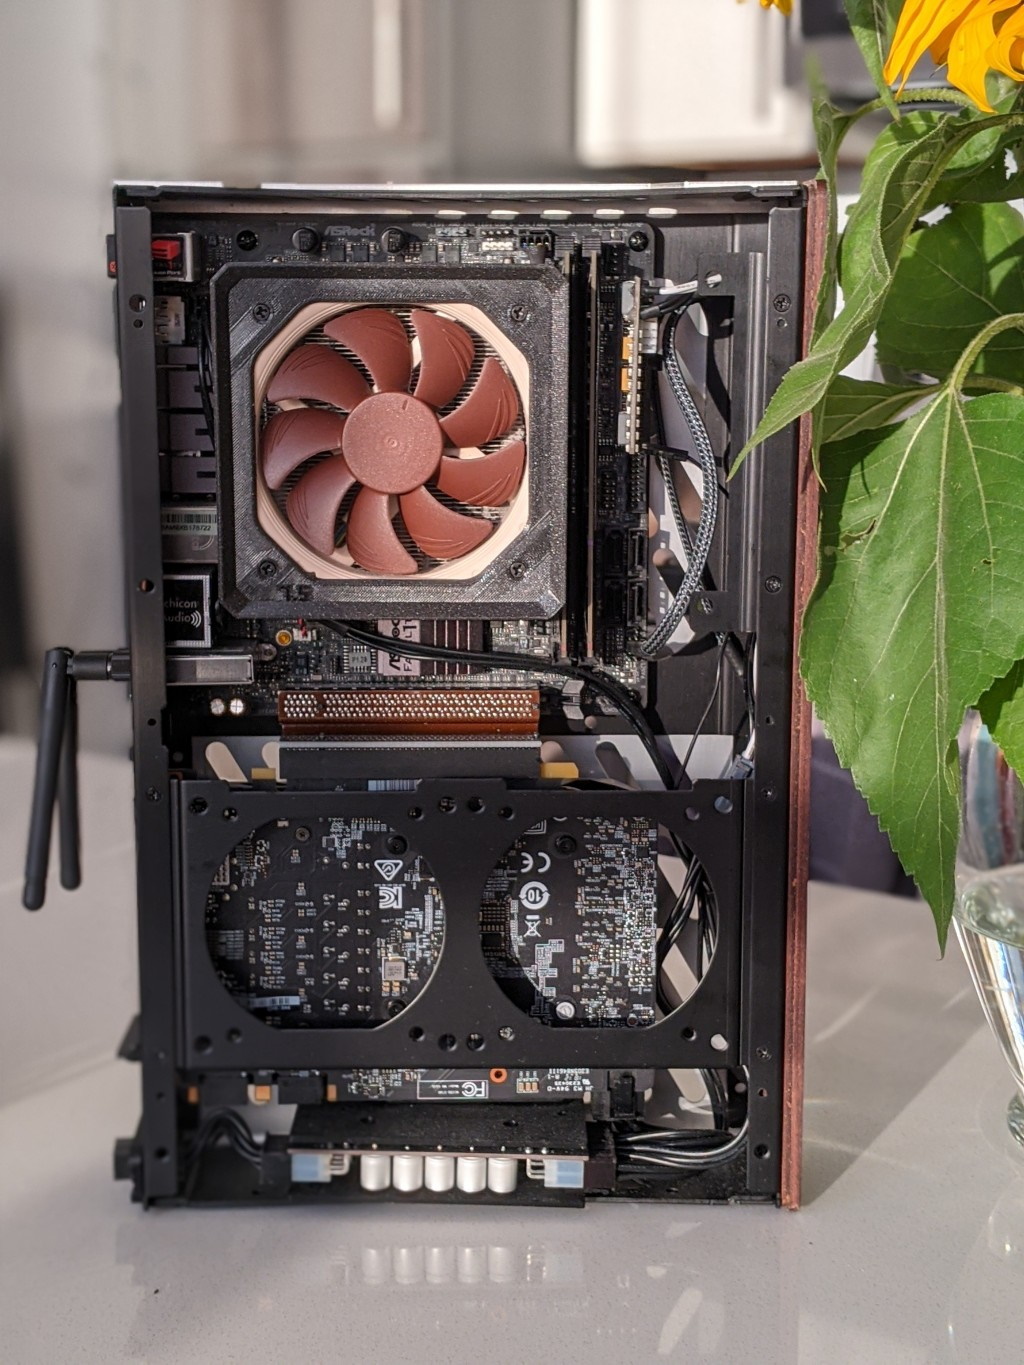
This upgrade in performance also came with an increase in power consumption and cooling requirements. My case, the S4M and Noctua’s cooler, NH-L9a with shroud, are pictured below
Deploying the 5900x into a SFF system
While the NH-L9a is best in class, there is only so much a 37mm tall cooler can do when faced with a 5900x. Noctua officially lists the 5900x as incompatible with the NH-L9a as the cooler cannot handle base clocks and the NH-L9a is not on AMD’s list of recommended coolers.

Noctua’s warning about cooling the 5900x with a NH-L9a
The first step is install the CPU under the cooler without tweaking anything and seeing if it will even run. We’ll be measuring the fan speed of the CPU cooler, the total power drawn by the CPU (called package power), and clock speeds. If unsure how to get these readings, I recommend HWiNFO64 which is a user friendly tool to get started.
🔗 Stock
Installing the 5900x under the NH-L9a and opening Cinebench R23 (free CPU benchmarking program) and running the CPU multi core benchmark for a minimum of 10 minutes immediately resulted in two things:
- Fan ramped up to 100%. Noctua fans at 100% are more bearable than others but no one would call it pleasant.
- Thermal throttle. Temperature of the hottest CCD1 spiked to 90 ℃, which caused CPU package power to drop 10 watts and all core frequencies to drop 100 MHz over the course of the ten minute run. This is due to Ryzen CPUs ability to downclock themselves and regulate power usage when temperatures exceed a certain threshold.
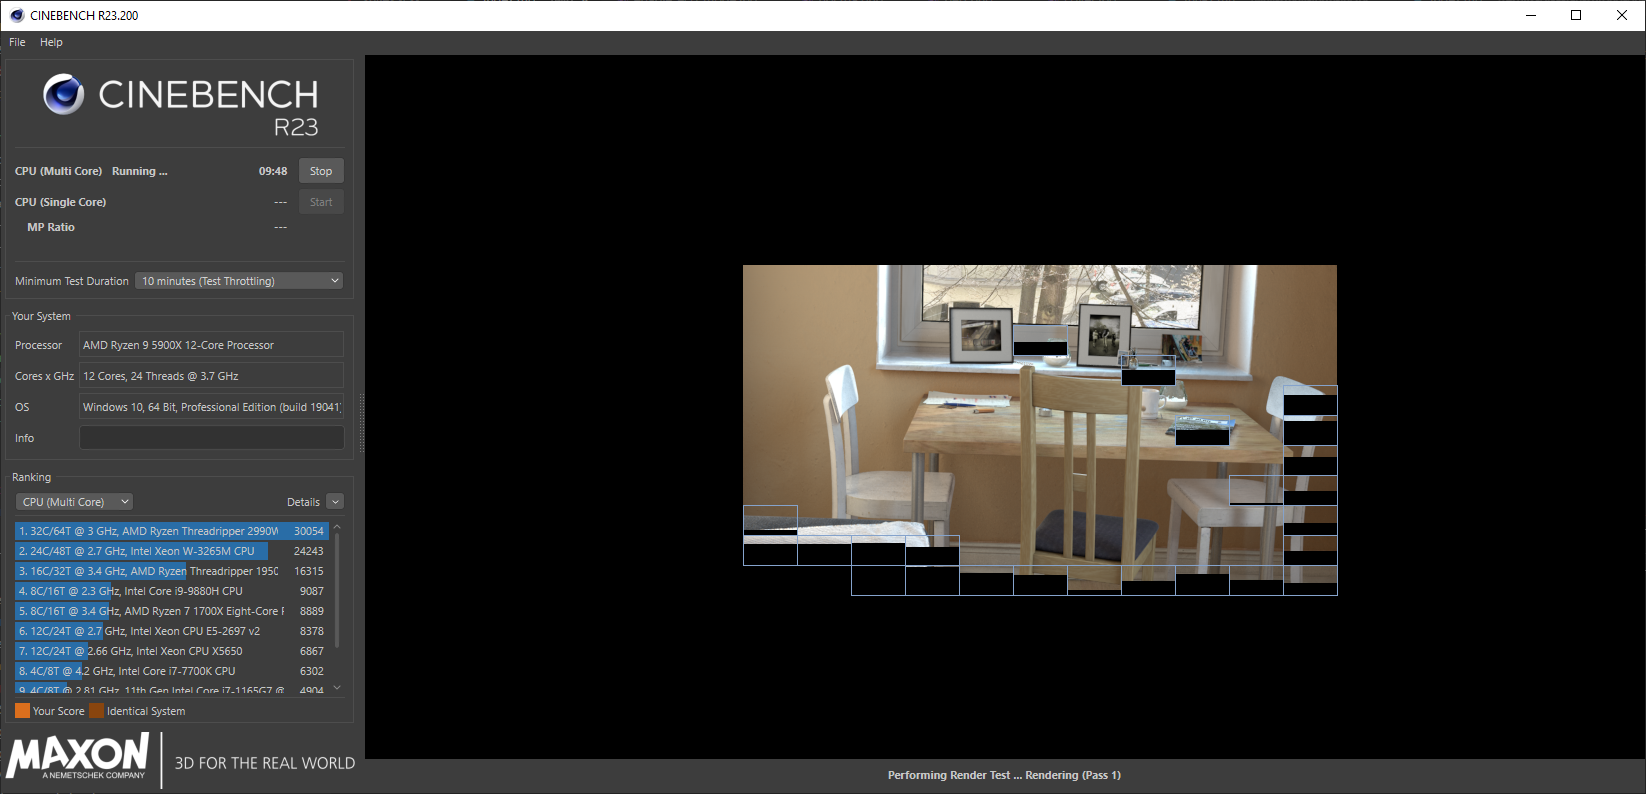
Cinebench R23 CPU multi core benchmark
After the benchmark is done running, we’ll select “File -> Quit” (this is important!) which will write out a file in the following directory (you can copy and paste the below into windows explorer):
%userprofile%\documents\MAXON
And you’ll find the scores from all the runs that completed in those 10 minutes under the following field (I snipped some runs so the snippet fits this post):
CBCPUXARRAY={19960,19836,19382,19385,19363,19351,19335,19327,19304,19281}
We can see that after 10 minutes of running the Cinebench score settled in around 19,300, which represents a little over a 10% drop in performance compared to the reported 22,046 Cinebench R23 results over at CG Director. So we’ve corroborated Noctua’s incompatibility statement, the NH-L9a can’t cool the 5900x sufficiently at stock settings. Optimum Tech also came to the same conclusion with the preceding CPU generation’s 16 core 3950x, finding 200 MHz decrease in all core frequency when paired with the NH-L9a.
We can conclude that at stock, the 5900x installed under the NH-L9a runs hot, loud, and restricted, but there is nothing inherently wrong running the 5900x this way. There’s been a adage in the tech community that running CPUs hot shorten their life spans, but AMD has refuted this for Ryzen 5000, saying:
AMD views temps up to 90C […] as typical and by design
While AMD doesn’t recommend installing the 5900x under the NH-L9a, they have our backs that it’s not a risky way to run it.
There are several ways to improve the situation.
Before we get to system modifications, you’ll want to rename the Cinebench results file, run the single core Cinebench benchmark, and safekeep both single core and multi core results. These will be our baseline.
🔗 Eco Mode and Customizing Power Package Tracking
By default, the 5900x has a Power Package Tracking, or PPT, of 142 watts, which declares that in total the CPU won’t exceed 142 watts. Adjusting the PPT to a lower value will allow us headroom to run the 5900x under the NH-L9a without thermally throttling and the noise that comes with that. As can be imagined, limiting the power the CPU can draw affects performance. This is why we created a baseline, so we can measure any impact.
The best way to adjust PPT is to enable eco mode. Enabling it will cap PPT to 87 watts (a reduction of 55 watts or 36%).
I will be showing how to enable eco mode in the BIOS of the ASRock’s B550 Phantom Gaming ITX. Every motherboard is different, but it should be possible to extrapolate to other boards. Another option is to do configuration in Ryzen Master, but I don’t use it as Ryzen Master is incompatible with CPU virtualization.
For ASRock’s B550 Phantom Gaming ITX, eco mode is enabled under:
Advanced\AMD Overclocking\Accept\ECO Mode
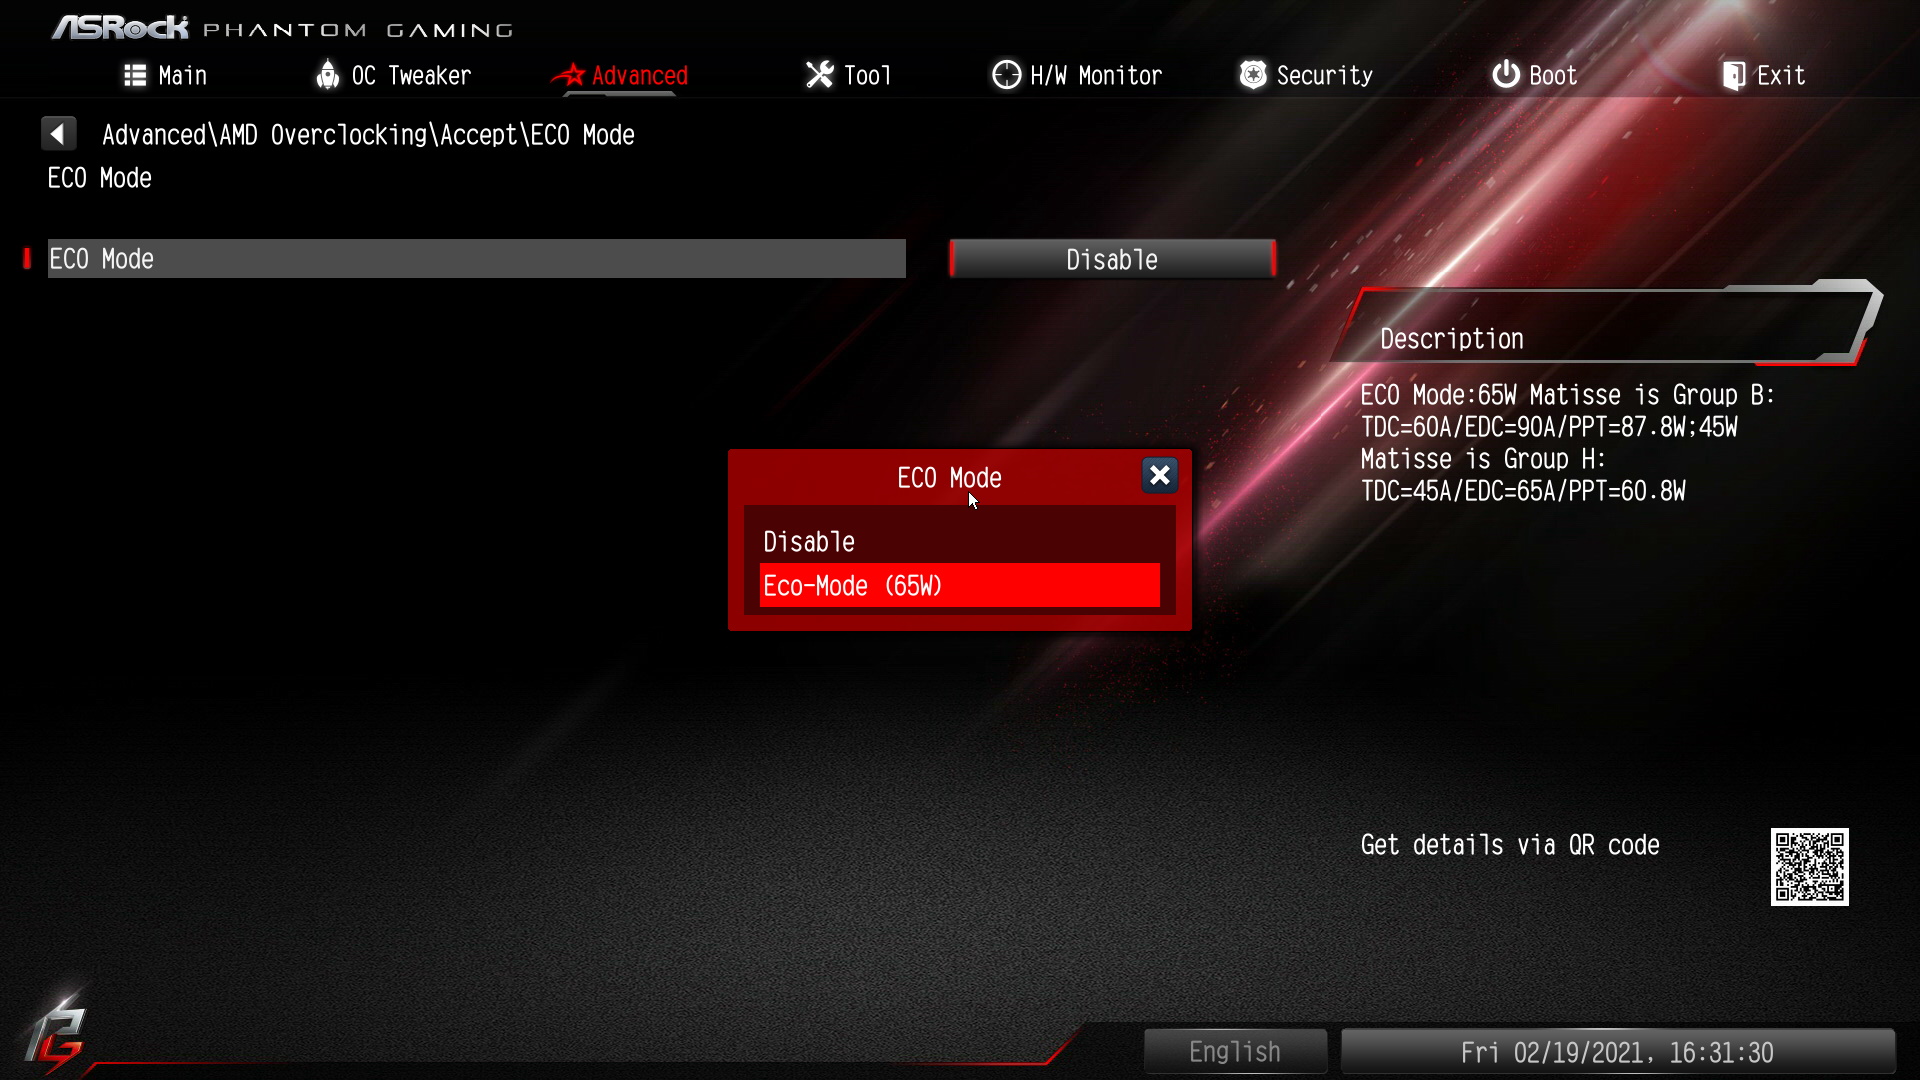
Enabling ECO Mode in ASRock’s B550 Phantom Gaming ITX
The eagle eye among readers may have noticed the discrepancy where I keep referring to PPT and said that eco mode has a PPT of 87 watts yet the above screenshot emphasizes 65 watts. Don’t get confused, the 65 watts is the new TDP, which, in my opinion, lacks purpose as PPT is much clearer than TDP to convey power expectations. Eco mode has a PPT of 87 watts and will consume up to 87 watts.
After saving, rebooting, and rerunning the 10 minute multi core and single core benchmarks, one will notice the following:
- A significant drop in the multi score. On the order of a ~17% drop compared to the thermal throttled stock run and a 27% drop compared to an unthrottled 5900x.
- No change in single core score.
I want to touch on the last point because I believe it is key that single threaded workflows remain unaffected by decreasing the power limit. With my Ryzen 2700, if I wanted to drastically change the power consumption, I’d have to set the frequency and voltage across all cores, which resulted in horrendous drop in a single threaded performance as the cores couldn’t boost above that like they normally would with Precision Boost. Thankfully later Zen processors have enabled a better way to adjust the power envelope.
Eco mode will be a good option for most systems running the 5900x under a low profile cooler. Your system will run colder and quieter without a hit to single threaded performance and it will only be a cost to multi core workloads that many find tolerable.
But if you’re me and running an undervolted GTX 1070, an 5900x in eco mode is still too much for a 250 watt power supply, as I would trip the overload protection of the power supply during gaming sessions. Coming from an undervolted 2700, the 87 watt PPT of eco mode needs to be brought down further.
In the BIOS one will find enabling eco mode already setup decent values for further PPT tweaking. This menu can be found under:
Advanced\AMD Overclocking\Accept\Precision Boost Overdrive
Below is a screenshot of me adjusting it from 87 watts. I changed it to 65 watts.
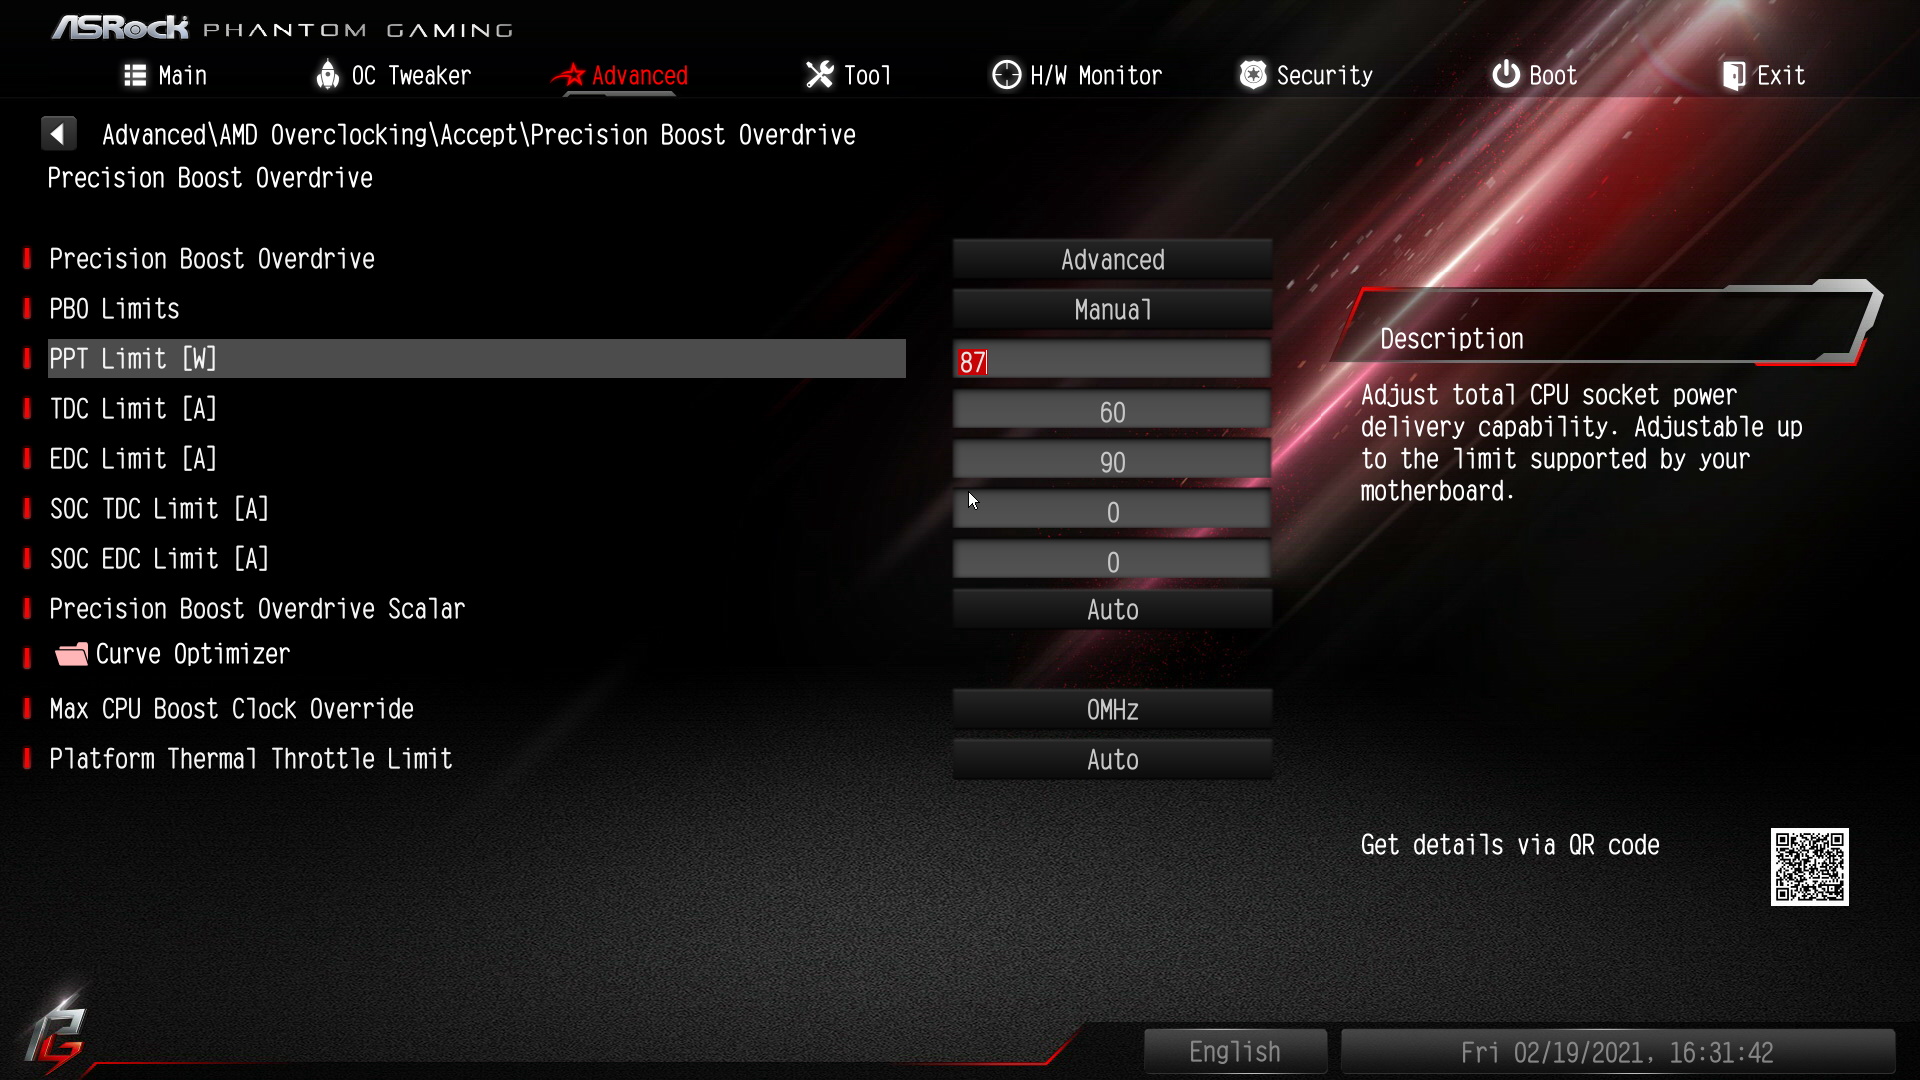
Adjusting PPT from 87 watts to 65 in ASRock’s B550 Phantom Gaming ITX
No other setting needs to be adjusted as the PPT will be the limiting factor. After running benchmarks with the new PPT, I found:
- An additional 20% drop in multi core performance
- No change in single core score
Who would have thought that decreasing the power limit by an additional 12 watts would cause multi core performance to drop so much? At this stage, it’s nearing half of what a stock 5900x should be able to achieve (it’s closer to 40% but I have a flair for the dramatic). It’s time to dive deeper.
🔗 Reclaiming Performance with Curve Optimizer
AMD recently released the Curve Optimizer, which is a way to tweak the voltage frequency curve such that a given frequency requires more or less voltage. In our case, we’ll be leveraging the curve optimizer to run frequencies at lower voltage so that we can claw back some of our multi core performance losses.
Back in the BIOS, the curve optimizer is found under:
Advanced\AMD Overclocking\Accept\Precision Boost Overdrive\Curve Optimizer
We’re going to enable it for all cores to have the same negative offset.
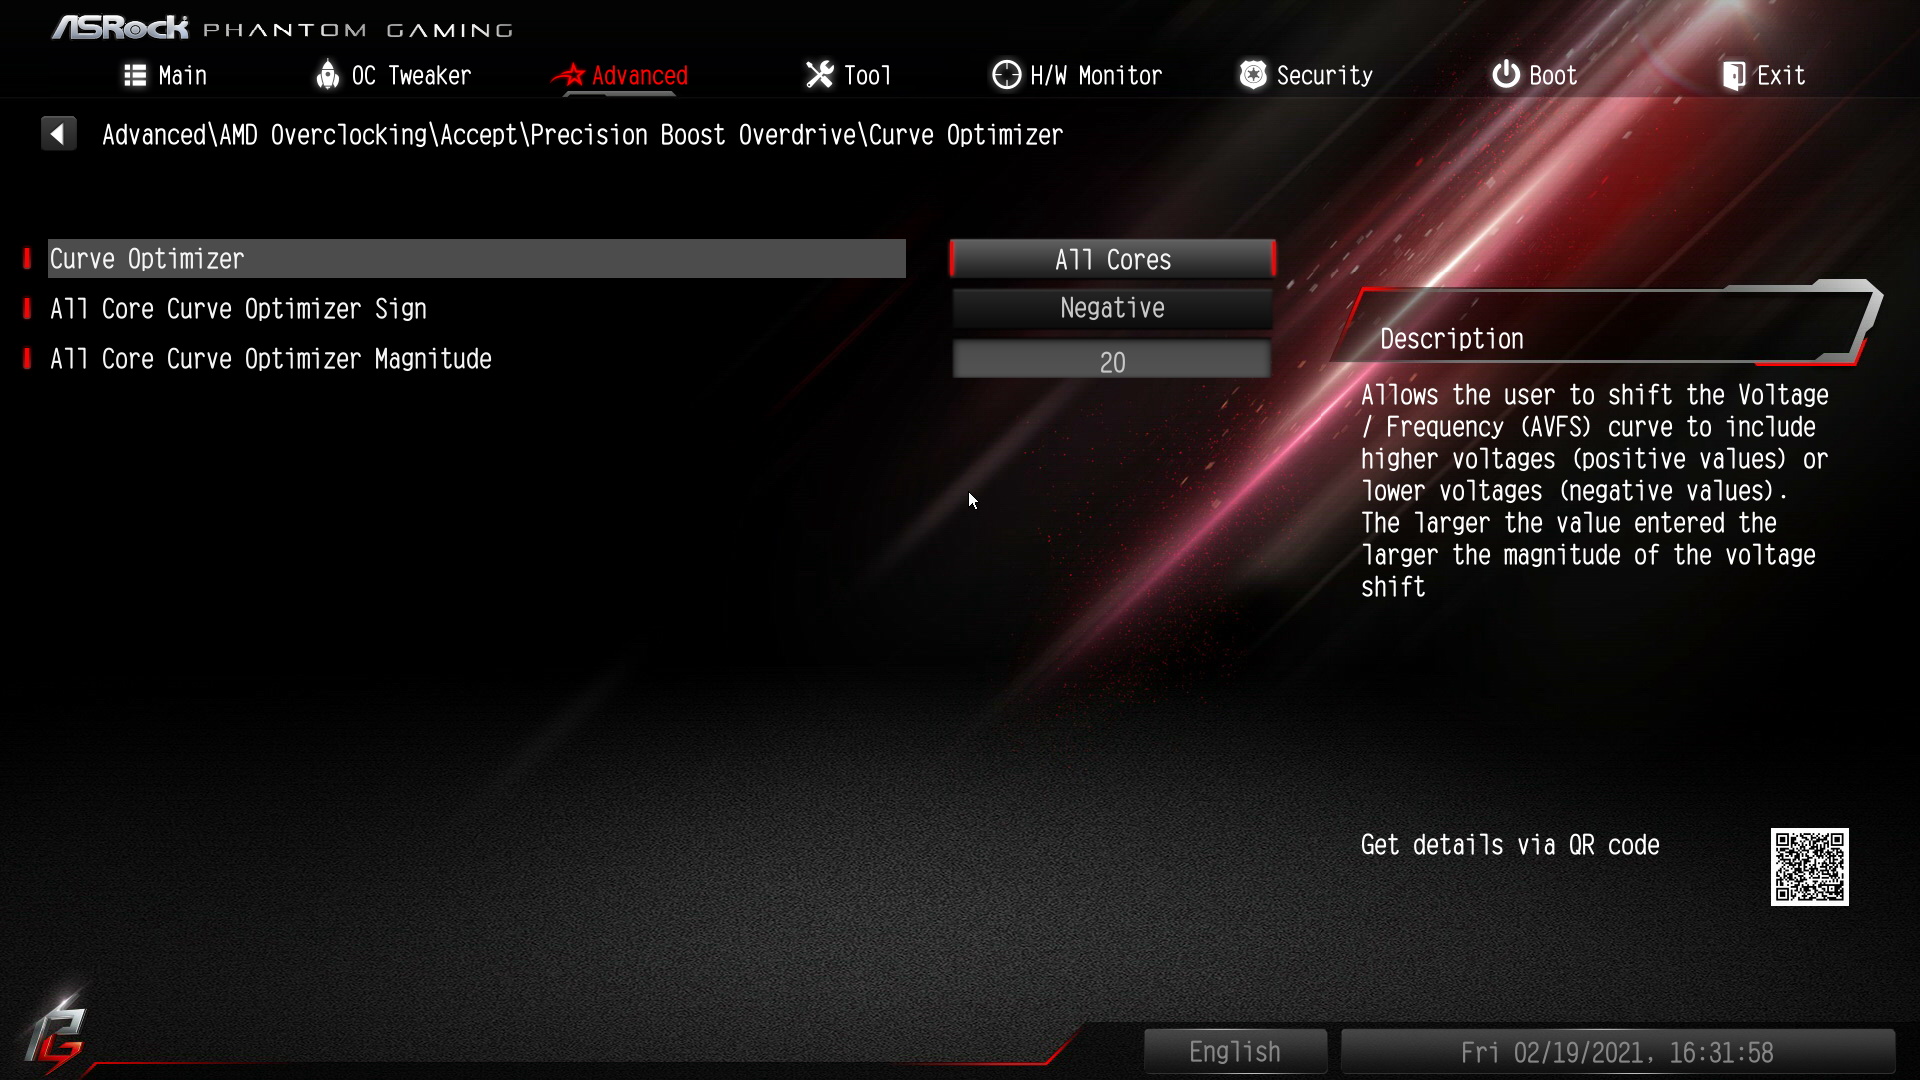
Setting an all core -20 modifier in ASRock’s B550 Phantom Gaming ITX
Each additional offset is a ~3mv decrease for a given frequency (not sure where this is documented, but this is what was observed), as the voltage during a benchmark run for a -20 offset was 875mV compared to the 925mV without an offset.
An interesting note is that the curve optimizer should only be available since AGESA 1.1.8.0, but the ASRock BIOS version I’m running (1.80) lists 1.1.0.0 and yet has the curve optimizer available. Bizarre, but not something I’m going to complain about.
My recommendation is to start at an offset of 5 and do increments of 5 each time you get through our 10 minute Cinebench run without issue.
The results from an offset of 20:
- A gain of 2250 points (20% increase) in Cinebench multi core score.
- No change in single core benchmarks
Quite the large increase but it doesn’t get us to the eco mode scores (16100 vs 14100).
🔗 Per Core Curve Optimizations
Not all cores are created equal. By setting an all core optimizer magnitude, the system’s stability is at the mercy of the “weakest” core. Weakest is in quotes because often the core that will fail first is our best cores. This is counterintuitive but we can confirm this in two steps.
First, to determine the core that failed, we will setup a view of the latest WHEA errors:
- Open Windows Event Viewer
- Create a new Custom View (call it anything – “which core crashed”)
- Create it with the properties shown below:
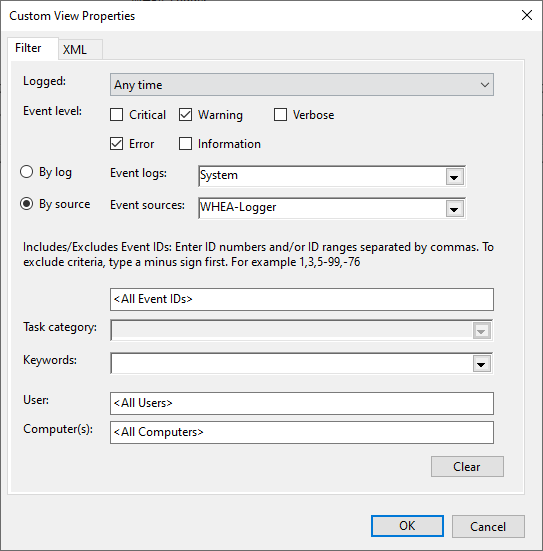
Creating a custom view for WHEA errors
Then creating and clicking our custom view will show us the error with the processor APIC ID.
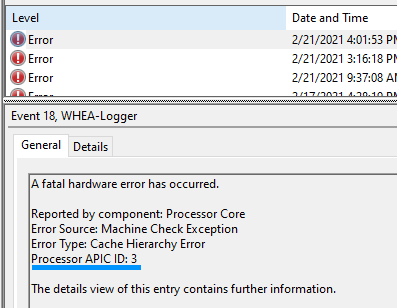
WHEA error showing that core 1 caused the crash
To calculate the core from the APIC ID, it is almost always floor(ID / 2). If there is concern that this is not how a system’s APIC IDs are configured, one method available is to use CPU-Z to dump out system information.
With the knowledge that core 1 (in this example) causes crashes, we can determine the best cores by opening HWiNFO64 and examining core clock sensors.
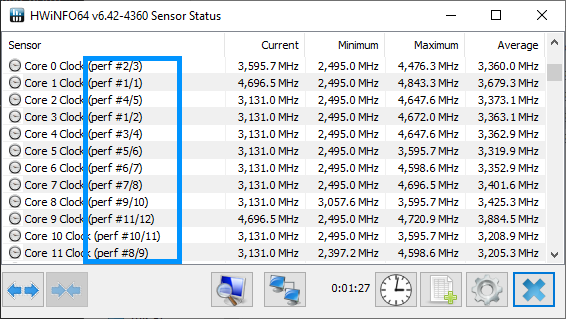
HWiNFO64 showing core performance ranked
In the above screenshot, we see that cores 1 and 3 are the best, followed by core 0 then core 4. This confirms the the statement earlier that the best cores are the first to fail as offsets increase. It does appear that HWiNFO has a bit of a UI bug, as I’m not sure what #1/1 followed by #1/2 is supposed to represent.
So we take this information back to the BIOS and instead of having an all core curve optimizer, we flip it to per core and set all the offsets to the most recent, stable all core offset.
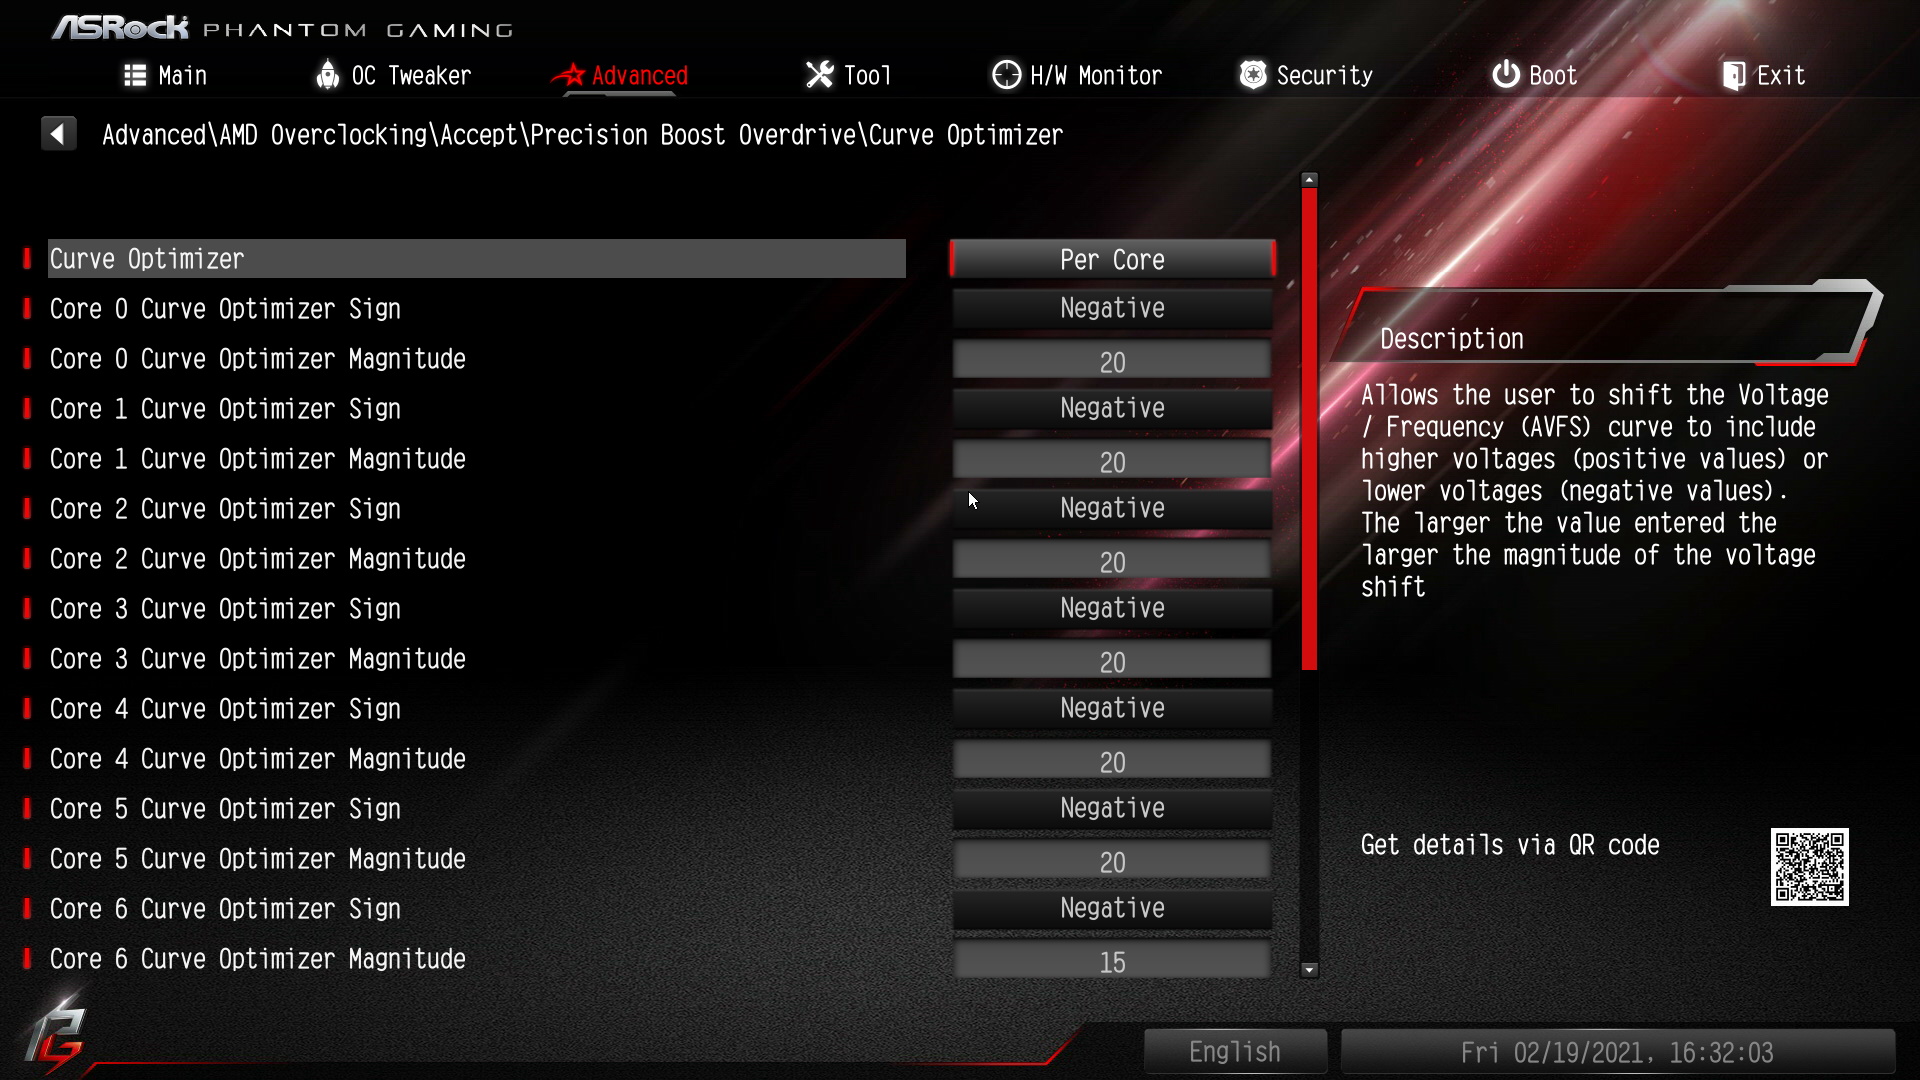
Setting per core modifiers in ASRock’s B550 Phantom Gaming ITX
This will be the most labor intensive part. I recommend starting with the worst CCX, increase offsets by 5, then 10, etc. Then do the same with the two worst cores on the best CCX – you shouldn’t be able to get quite as far. The best cores won’t need to be touched.
There is a tool called ClockTuner for Ryzen, abbreviated CTR, that can help by automating the process of zeroing in on the best configuration. I’ll touch on CTR briefly for a couple reasons:
- CTR version 2.1 is nearly out of paywalled beta and it will brings support for the curve optimizer
- I want to be conscious about the number of programs I peddle in articles and limit them.
- Agesa 1.2.0.0 is a requirement and the ASRock’s B550 Phantom Gaming ITX board does not yet have an update for Agesa 1.2.0.0
- CTR is in rapid iteration mode and bugs are constantly being fixed, so there are some rough edges
- I need to limit this article to a reasonable length and save a dive into CTR for a future article
To give but a glimpse of CTR, it will show how good a core is for overclocking:
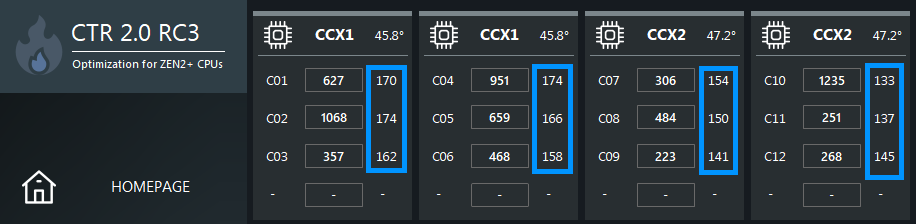
ClockTuner for Ryzen with weight of cores highlighted
These values, when ranked, will match HWiNFO64. Both programs agree that for my 5900x Core 0 (C01) and Core 3 (C04) are the best, but now we have a better idea of exactly how good (or bad) a core is compared to others. While we won’t be using CTR in this article, we can use the new found values to make better informed curve optimizer offsets though the exact formula for transcribing these weights to offsets would still involve a system of guesses and checks.
Keep in mind that per core results will vary due to the silicon lottery. If all the cores are about the same quality, there may not be a difference to going to per core curve optimizations.
Setting a per core curve only netted a 2% increase in Cinebench scores. It’s a small step, but a step in the right direction. I eagerly await CTR 2.1 and ASRock’s Agesa 1.2 update to see how much of an improvement it will yield over hand optimizations.
🔗 Results
While running all these benchmarks, I had OhmGraphite, a hardware sensor collector, running in the background. It’s not a requirement to run OhmGraphite, you can often accomplish the same thing by monitoring HWiNFO64 or having it write to a CSV.
I overlaid the data reported by OhmGraphite: temperature, fan speed, package power, and all core frequency from each run to form a benchmark monitoring dashboard.
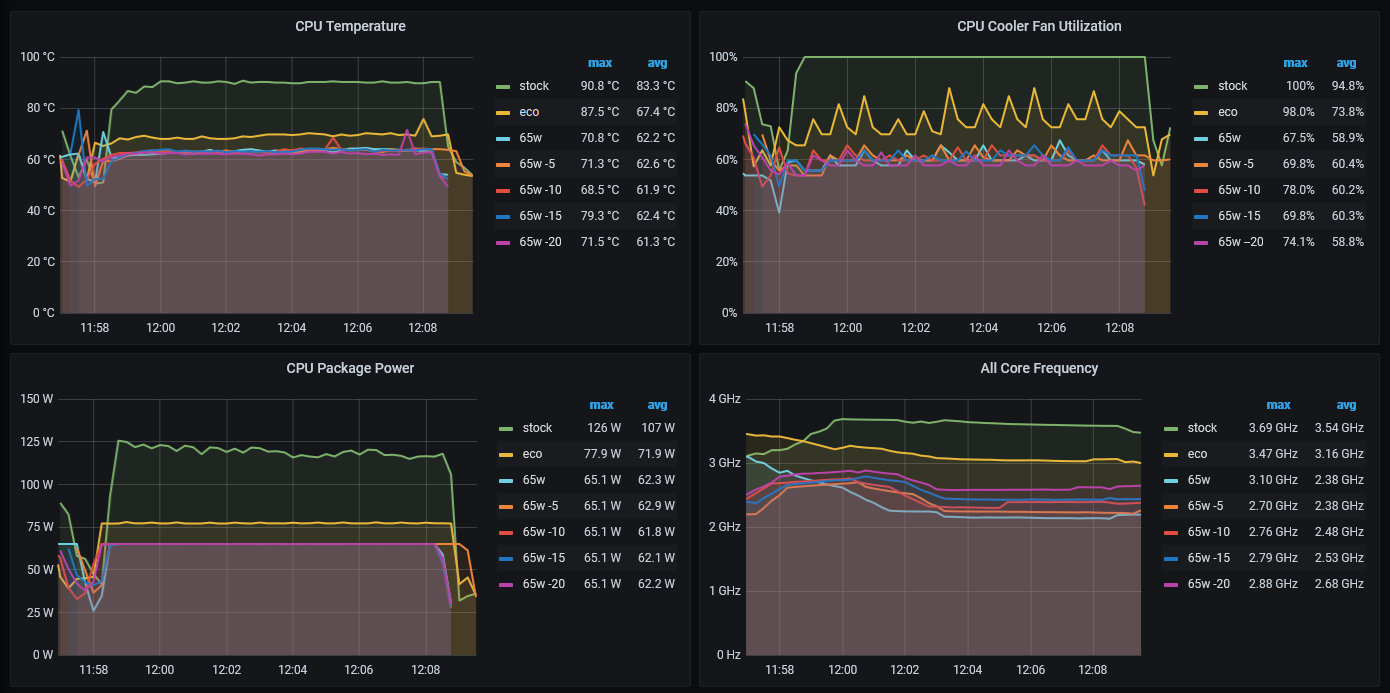
Temperature, fan speed, power, and all core frequency. Click to enlarge
There’s a lot to unpack:
- Stock throttled at 90 ℃ with fans at 100%. This can be seen in the CPU Package Power graph, as it starts out consuming 125 watts but then drops to 116 watts at the end.
- Eco mode was middle of the road: temperature dropped 20 ℃, fan speed 25%, and a 400 MHz all core frequency
- From stock, 65w PPT dropped 30 ℃, fan speed 40%, and nearly 1500 MHz all core frequency
- From stock 65w PPT with -20 offset maintained the benefits of 65w PPT with more tolerable 1000 MHz reduction in all core frequency
Not shown in the graphs is that while the 65 watt PPT config is the only one to reach its limit during all core workloads, both stock and eco mode would exceed the power used in all core workloads during lighter workloads, which sounds counterintuitive but is due to current density. Why the 65 watt PPT config is able to hit the PPT limit during all core workloads is due to me omitting to adjust current values (eg: TDC) away from those set by eco mode. Below is a screenshot of TDC and EDC at their limits (and PPT is not) during an eco run.
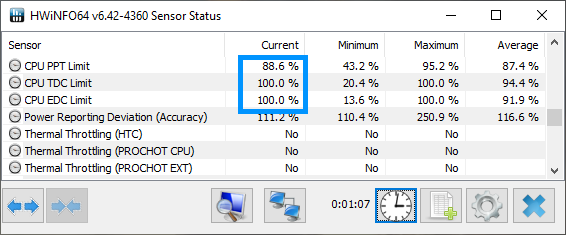
TDC and EDC limits reached before PPT limit in eco mode
I must save examining this peculiarity for another article, like investigating what happens to eco mode’s all core workload power usage and benchmark scores when limits on TDC and EDC are lifted.
So there’s no denying it, settling for a 1000 MHz reduction from stock is a huge decrease, but then again we should expect some performance sacrifices when the power was reduced from 142 watts to 65 (a reduction of 54%). Anyone disheartened at the thought that they are gimping their newly purchased processor should remember:
- Single core performance was not harmed in any of the modifications
- Performance decreases at a decaying rate as power decreases.
Another way of looking at the last point is efficiency per watt. If we chart the cinebench scores compared to the PPT of each config we’ll find that the config we ended with is the most efficient of all – a 40% increase compared to stock conditions.
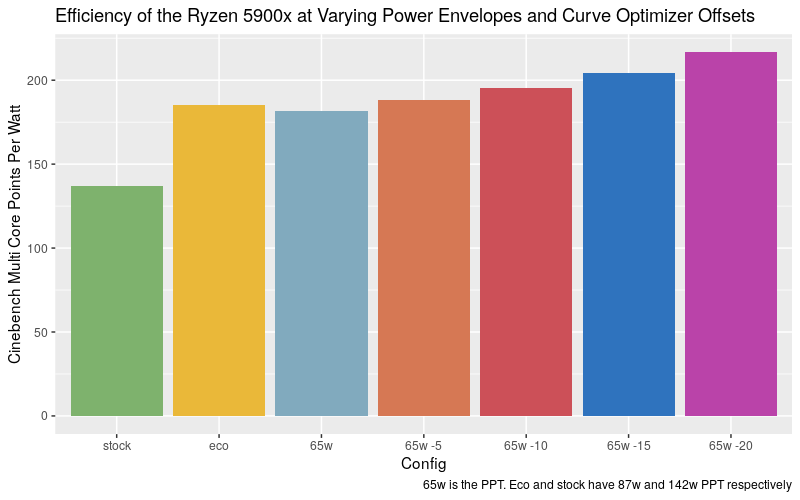
Efficiency of the Ryzen 5900x measured in Cinebench Multi Core Points per Watt
This should be somewhat intuitive to those who’ve overclocked before as one will reach diminishing returns the more power they pump into the system. And the good news is that there isn’t a tangible difference in performance per watt between the 87 watt PPT (eco mode) and 65 watt, so most users should be ok to enable eco and then apply curve offsets as shown. In fact it is arguable that eco mode is more efficient as the all core workload didn’t reach the 87 watt PPT limit. I may just have to investigate what happens if one continues down the path of ever decreasing PPT and see if there is a clear winner in performance per watt.
In the end, I’m happy with the results. The 5900x is still fast by any standard but now it sips power.
The cinebench scores and R code to generate the plots are housed in the Github repo.
-
Core Chiplet Dies. A Ryzen 5900x has 2 CCDs with 6 enabled cores each for a total of 12 cores ↩︎